Expert Tip: Did you know that visualizing your biohacking protocols can significantly enhance your adherence and overall success? Utilizing features like protocol progress visualization graphs, charts, and calendars in your MyLongevityApp not only provides a clearer picture of your journey but can also boost motivation and accountability.
When you track your progress with visual tools, you engage both your analytical and emotional sides, creating a more holistic approach to your biohacking efforts. Research has shown that individuals are more likely to stick to their health goals when they can see tangible results. In fact, studies indicate that visual feedback can increase motivation by as much as 30%. This means that regularly reviewing your progress through graphs and charts can keep you more committed to your longevity protocols.
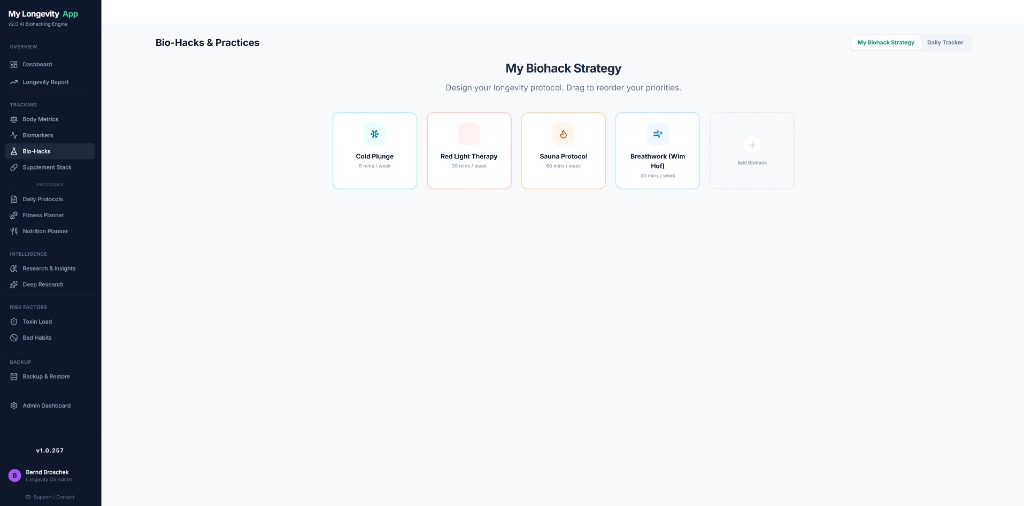
To maximize the effectiveness of these visualization tools, consider setting specific, measurable goals within your app. For example, if you’re aiming to improve your sleep quality, you can track your sleep hours and quality ratings over time. By entering this data into the app, you can generate graphs that display your sleep patterns. This allows you to identify trends, such as which lifestyle changes correlate with improved sleep.
Furthermore, integrating a calendar feature can help schedule your biohacking activities, ensuring you consistently engage with your protocols. By marking key dates, such as when you start new supplements or changes in your diet, you create a timeline that can be referenced against your progress graphs.
Together, these tools not only make your journey towards longevity more organized but also provide you with a dynamic way to reflect on your progress and adjust your protocols as needed. Embrace the power of visualization with the MyLongevityApp to make your biohacking efforts more effective and rewarding.