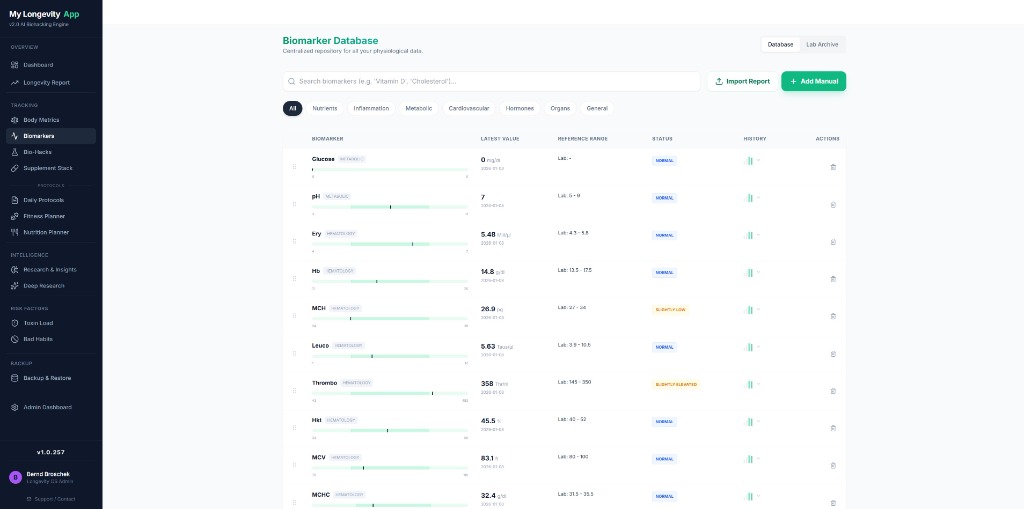
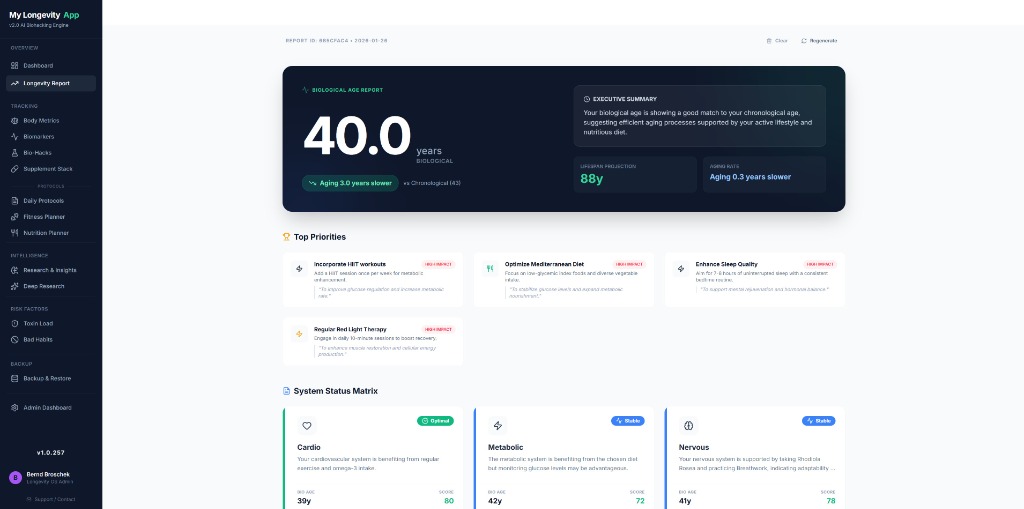
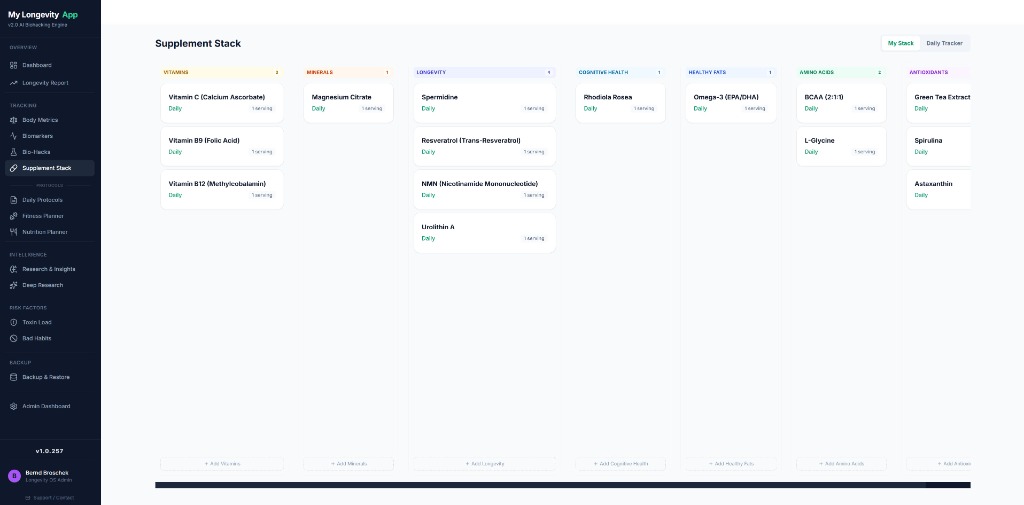
"Transform your health insights into clear, actionable visualizations for better decision-making."
In a world overflowing with health information, it’s overwhelming to sift through mountains of data without clarity. You want to understand what your numbers mean and how they impact your journey towards longevity, yet the complexity can feel daunting. A health data visualization charts app can provide the clarity you seek, transforming confusion into insightful visuals that empower you to take control of your well-being.
Advanced biohacking tools at your fingertips.
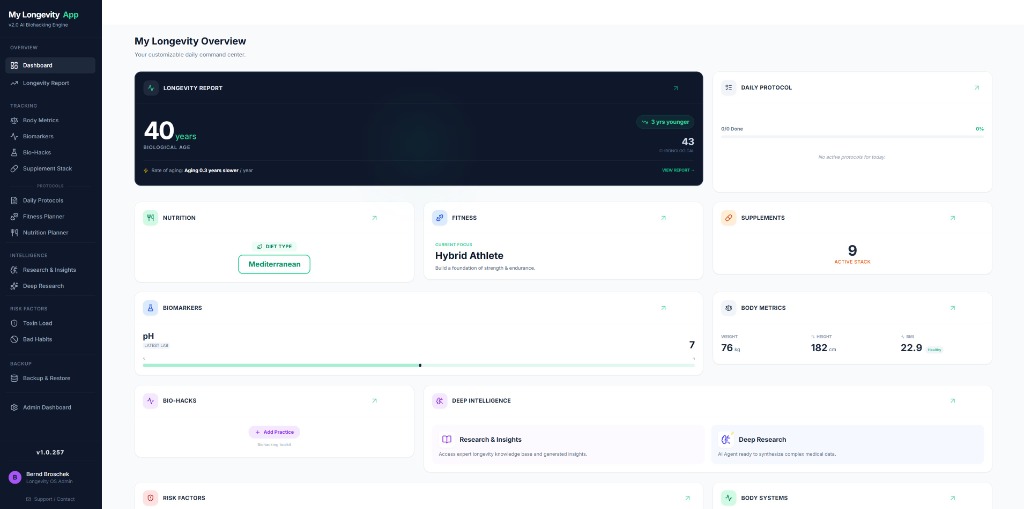
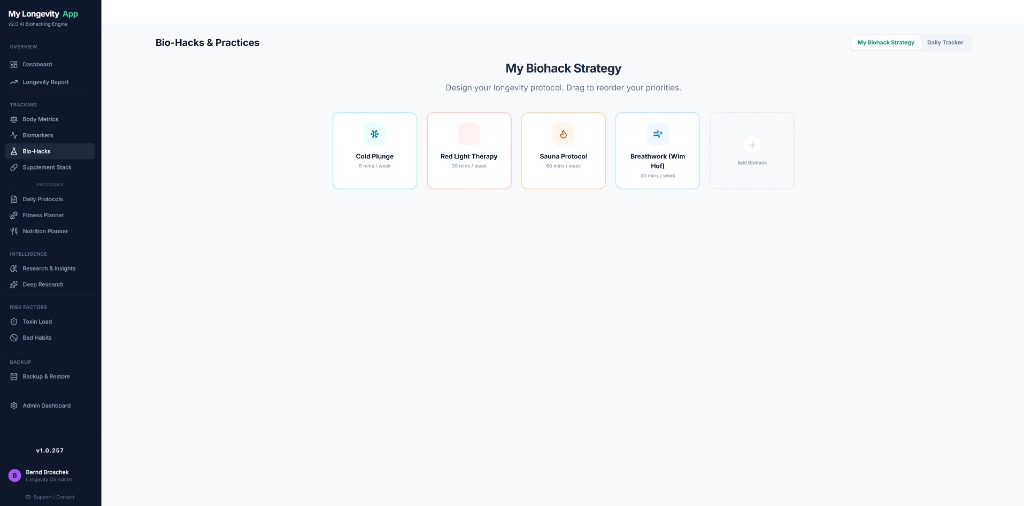
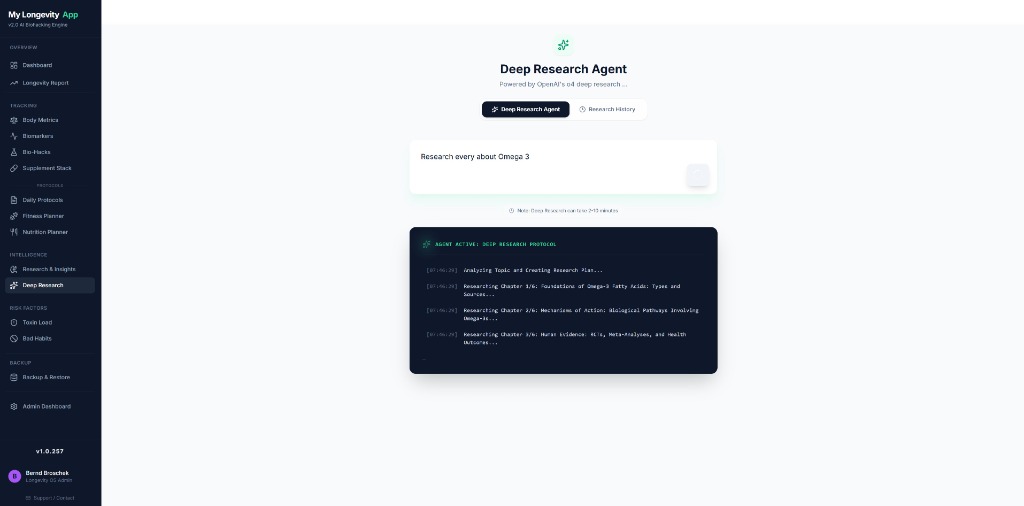
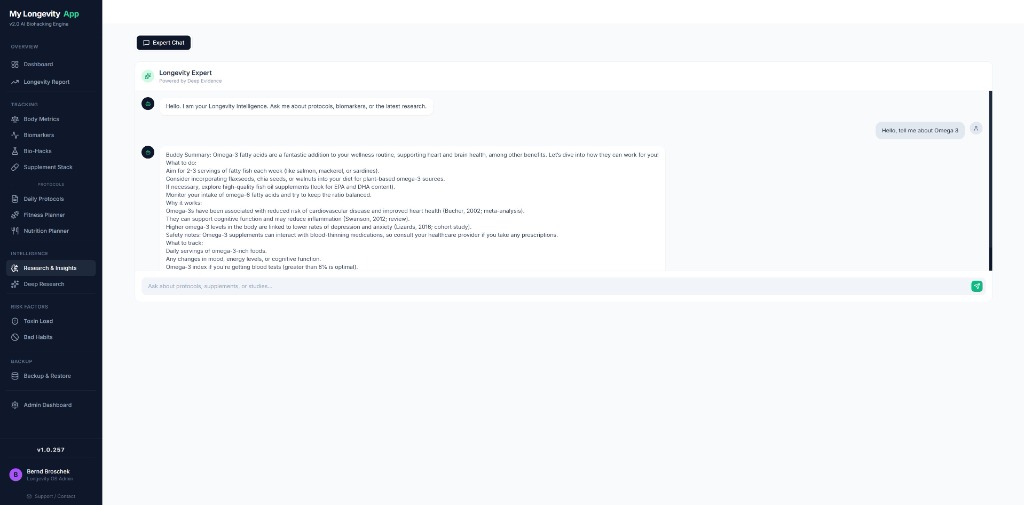
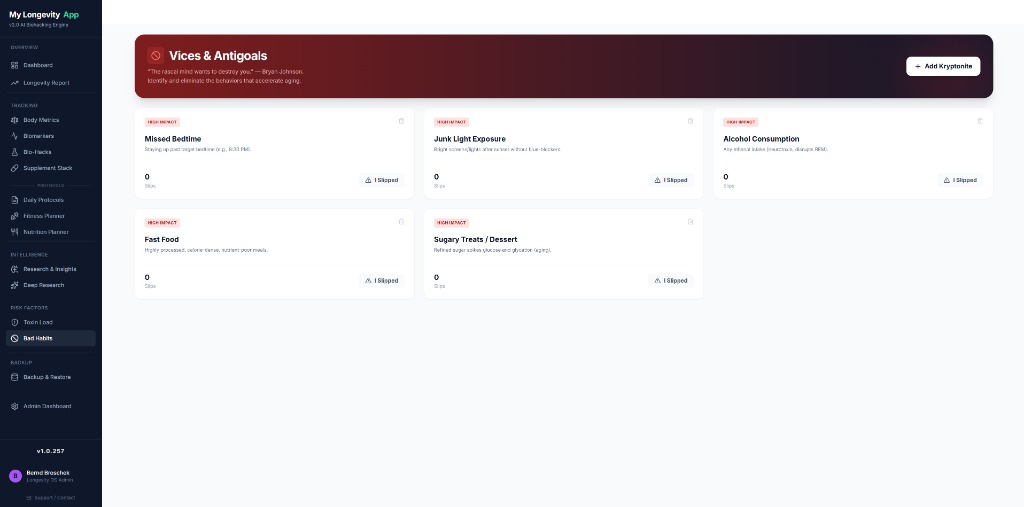
10 integrated modules working together.
Create your account in 30 seconds. No credit card required.
Upload blood work, track body metrics, or start with our AI questionnaire.
Receive your biological age score, personalized reports, and action plan.
Choose the plan that fits your biohacking journey.
Our health data visualization charts app features an intuitive layout, making it easy for users to navigate and analyze their health metrics.
With our health data visualization charts app, users can tailor their charts to focus on specific metrics that matter most to their longevity goals.
The health data visualization charts app provides real-time updates, allowing users to track changes and make informed decisions for better health outcomes.
Join thousands of biohackers optimizing their health.
"MyLongevityApp helped me lower my biological age by 5 years. The biomarker tracking is a game-changer."
"Finally one app that combines supplements, blood work, and daily protocols. I love the weekly planner."
"The AI research agent alone is worth the subscription. It saves me hours of reading every week."
Effective health data visualization charts are essential for tracking longevity and biohacking metrics, as they can translate complex data into understandable insights. Here are some of the most impactful types of charts to utilize in this context.
Line graphs are particularly useful for showing trends over time. For example, you can track changes in biomarker levels, such as blood glucose or cholesterol, and visualize how lifestyle adjustments affect these metrics. This type of chart allows individuals to see patterns and make informed decisions based on their long-term health trajectories.
Bar charts can also offer clarity, especially when comparing different metrics or groups. For instance, a bar chart might display various biohacking interventions—such as different diets or supplements—alongside their respective impacts on energy levels or cognitive function. This makes it easier to identify which methods yield the best results.
Pie charts can be effective in illustrating proportions, such as the distribution of macronutrients in your diet or the time spent on various biohacking practices. This visualization helps users understand their health habits at a glance, promoting more mindful choices.
For a comprehensive approach, consider using a health data visualization charts app like MyLongevityApp. This platform integrates various types of charts, allowing users to track multiple metrics in one place. By leveraging these visual tools, individuals can effectively monitor their progress and adjust their biohacking strategies for optimal longevity.
To maximize the benefits of data visualization, regularly update your charts and reflect on the insights they provide. This practice can enhance your awareness of how different factors contribute to your overall health and longevity goals.
A health data visualization charts app serves as a powerful tool for users seeking to understand complex health trends over time. By transforming raw health data into visually engaging charts and graphs, these apps enable users to identify patterns and correlations in their health metrics that might otherwise go unnoticed. For instance, tracking variables such as blood pressure, heart rate, and sleep quality over months or years can reveal significant trends that inform better health decisions.
One key feature of a health data visualization charts app is its ability to present information in an easily digestible format. Users can quickly grasp how their lifestyle changes, such as diet or exercise, impact their health metrics. By visualizing data over time, users can see the effects of their actions, making it easier to adjust their habits for optimal health outcomes. This dynamic feedback loop fosters a deeper understanding of individual health, empowering users to take charge of their well-being.
Additionally, apps like MyLongevityApp enhance the user experience by integrating personalized insights and recommendations based on the visualized data. This tailored approach not only simplifies the process of tracking health trends but also encourages users to engage more actively with their health journeys. By contextualizing data within the larger picture of longevity and biohacking, users are more likely to understand the importance of maintaining their health over time.
Incorporating a health data visualization charts app into your wellness routine can significantly enhance your ability to monitor and interpret your health trends. Start by selecting an app that aligns with your health goals and begin tracking your data consistently for a clearer view of your health trajectory.
Integrating real-time data into health data visualization charts is crucial for individuals focused on biohacking because it allows for immediate insights into physiological changes and health trends. Biohackers often experiment with various diets, supplements, and lifestyle changes to optimize their health. Access to real-time data empowers them to make informed decisions based on the latest information rather than relying solely on historical data, which may not reflect current conditions.
For instance, a health data visualization charts app that incorporates real-time metrics can display fluctuations in vital signs, sleep quality, and even biochemical markers as they happen. This immediacy enables users to identify patterns and correlations that may not be apparent with static data. If a biohacker tries a new supplement, they can monitor their body's response in real time, adjusting their approach based on immediate feedback.
Additionally, real-time data fosters a proactive mindset. Instead of waiting for periodic health check-ups to understand their progress, individuals can continuously track their journey towards better health and longevity. This not only enhances motivation but also cultivates a deeper understanding of one's body.
MyLongevityApp exemplifies this integration by offering features that allow users to visualize their health data dynamically, making biohacking more effective and personalized.
To maximize the benefits of biohacking, individuals should seek out health data visualization charts apps that provide real-time analytics, empowering them to adapt their strategies swiftly and effectively for optimal health outcomes.
When selecting a health data visualization charts app, users should prioritize features that enable a thorough analysis of their health metrics. One essential aspect is the ability to integrate various data sources seamlessly. The app should connect with fitness trackers, wearables, and other health apps to consolidate information, allowing users to visualize their overall health picture rather than isolated data points.
Another crucial feature is customizable chart options. Users should look for an app that allows them to create graphs and charts that reflect their specific health goals. Whether tracking weight, heart rate, sleep patterns, or nutrition, the flexibility to tailor visualizations can lead to better insights and more actionable data. For instance, MyLongevityApp offers customizable charts that help users monitor their progress against personal benchmarks.
Data analysis tools are also vital. The app should include features like trend analysis and predictive analytics, which can highlight patterns over time and offer forecasts based on historical data. This capability encourages users to engage with their health data actively and make informed decisions regarding their wellness strategies.
Finally, user-friendly design is non-negotiable. An intuitive interface ensures that users can navigate the app effortlessly and interpret the visualizations without unnecessary confusion. Clear labeling, interactive elements, and easy navigation enhance the overall user experience.
For those looking to optimize their health journey, it’s essential to choose a health data visualization charts app that not only presents data but also empowers users to understand and act upon it effectively. Consider prioritizing these features to maximize your health insights and longevity outcomes.
When evaluating different health data visualization charts apps to support longevity goals, prioritizing specific metrics and indicators is crucial. Firstly, focus on tracking biomarkers such as blood pressure, cholesterol levels, and glucose levels. These indicators provide essential insights into cardiovascular health and metabolic function. Regular monitoring of these metrics can help identify potential health risks early, enabling proactive interventions.
Another important aspect to consider is the app's ability to track lifestyle factors, including physical activity, sleep quality, and nutrition. A comprehensive health data visualization charts app should allow users to input daily habits and correlate these with health outcomes. For instance, understanding how sleep patterns affect energy levels or how dietary choices influence blood sugar can empower users to make informed changes for better longevity.
Additionally, consider apps that incorporate stress management metrics, such as heart rate variability (HRV) and mindfulness practices. High levels of chronic stress can significantly impact health and longevity, making it essential to monitor and address these factors. MyLongevityApp, for example, integrates these various metrics into a cohesive dashboard, making it easier for users to visualize their health journey.
Lastly, prioritize apps that offer personalized insights and recommendations based on collected data. This feature can help users adapt their strategies to meet specific longevity objectives. By focusing on these key metrics and indicators, you can leverage health data visualization to create a clear path toward improved health and extended longevity.
Track your health metrics consistently and leverage the insights provided by your chosen app to inform your daily choices and optimize your longevity strategy.
Join 10,000+ biohackers optimizing their health with AI.
Start Your 7-Day Free TrialNo credit card required. Cancel anytime.