Expert Tip: Understanding the nuances of a blood test normal ranges chart can be a game-changer in your longevity journey. While these charts provide essential reference points for various biomarkers, interpreting them in the context of your individual health is crucial for effective biohacking.
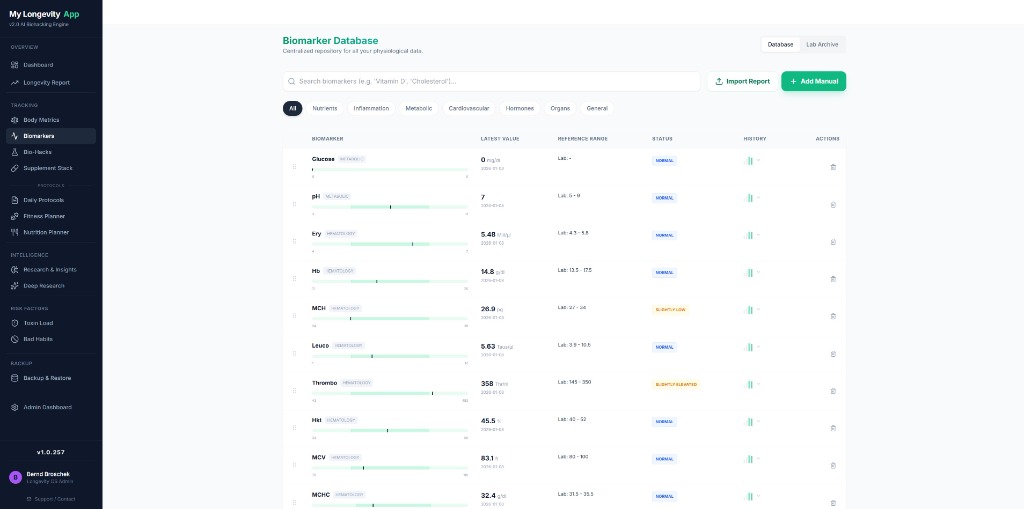
First, familiarize yourself with the most common biomarkers in standard blood tests, such as glucose, cholesterol levels (LDL and HDL), and inflammatory markers like C-reactive protein (CRP). Each of these indicators plays a significant role in your overall health, influencing factors such as cardiovascular health and metabolic function. For instance, a high LDL cholesterol level can signal a risk for heart disease, while an elevated CRP level may indicate systemic inflammation, which is linked to numerous chronic conditions.
However, the “normal” ranges on the blood test normal ranges chart may not apply universally. Individual variations, including age, sex, genetics, and lifestyle factors, can significantly influence these numbers. For example, while a fasting glucose level under 100 mg/dL is generally considered normal, some individuals may experience symptoms of insulin resistance even within this range. This is where biohacking comes into play: by using your blood test results as a baseline, you can make informed decisions about dietary changes, exercise routines, or supplementation to optimize your health.
One actionable step is to track your biomarkers over time rather than relying solely on a single test result. This can provide a clearer picture of your health trends and help you identify any deviations that may warrant further investigation. Additionally, consider consulting with a healthcare professional who can help interpret your results in the context of your overall health and wellness goals. By combining knowledge from blood tests with a proactive approach to lifestyle changes, you can significantly enhance your longevity and overall well-being.